
Page 25 - ความสุขของชาวพังงา ภูเก็ต และชาวบ้านน้ำเค็มหลังสึนามิ
P. 25
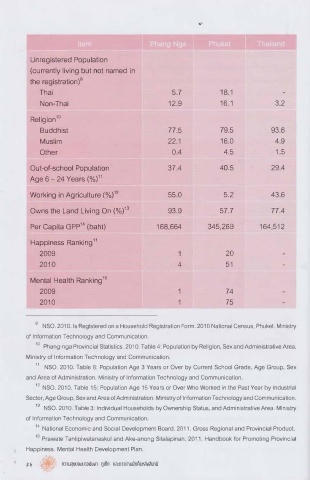
Unregistered Population
          (currently living but not named in
          the registration) 9
             Thai                                  5.7            18.1
             Non-Thai                             12.9            16.1            3.2

          Religion 1D
             Buddhist                             77.5            79.5           93.6
             Muslim                               22.1            16.0            4.9
             Other                                  0.4            4.5            1.5

          Out-of-school Population                37.4            40.5           29.4
          Age 6- 24 Years (%) 11

          Working in Agriculture (%) 12           55.0             5.2           43.6

          Owns the Land Living On (%) 13          93.9            57.7           77.4
                         14
          Per Capita GPP (baht)                168,664        345,269        164,512

          Happiness Ranking  11
             2009                                    1             20
             2010                                    4             51
          Mental Health Ranking  15
             2009                                    1             74
             2010                                    1             75


           9
              NSO. 2010. Is Registered on a Household Registration Form. 2010 National Census, Phuket. Ministry
         of Information Technology and Communication.
            10
              Phang-nga Provincial Statistics. 2010. Table 4: Population by Religion, Sex and Administrative Area.
         Ministry of Information Technology and Communication.
            11
              NSO. 2010. Table 8:  Population Age 3 Years or Over by Current School Grade, Age Group, Sex
         and Area of Administration. Ministry of Information Technology and Communication.
           12   NSO. 2010. Table 15: Population Age 15 Years or Over Who Worked in the Past Year by Industrial
         Sector, Age Group, Sex and Area of Administration. Ministry of Information Technology and Communication.
           13
              NSO. 2010. Table 3: Individual Households by Ownership Status, and Administrative Area. Ministry
         of Information Technology and Communication.
           14  National Economic and Social Development Board. 2011. Gross Regional and Provincial Product.
           15
             Prawate Tantipiwatanaskul and Ake-anong Sitalapinan. 2011. Handbook for Promoting Provincial
         Happiness. Mental Health Development Plan.

         z Ir      n)lUiJUUi>tJUl)WtJtJl  Qlfin  ua:Ul)UlUUllflUN<ltJaUl□